Projects


Customer Segmentation Analysis Dashboard

Customer Segmentation and Product Performance Analytics Dashboard


   This project is an end-to-end Business Intelligence analysis built using Microsoft Power BI to evaluate customer performance and product profitability in an e-commerce context using the Global Superstore dataset. The goal of the project is to transform raw transactional data into actionable insights that support data-driven decision-making across sales, pricing, customer strategy, and product management.
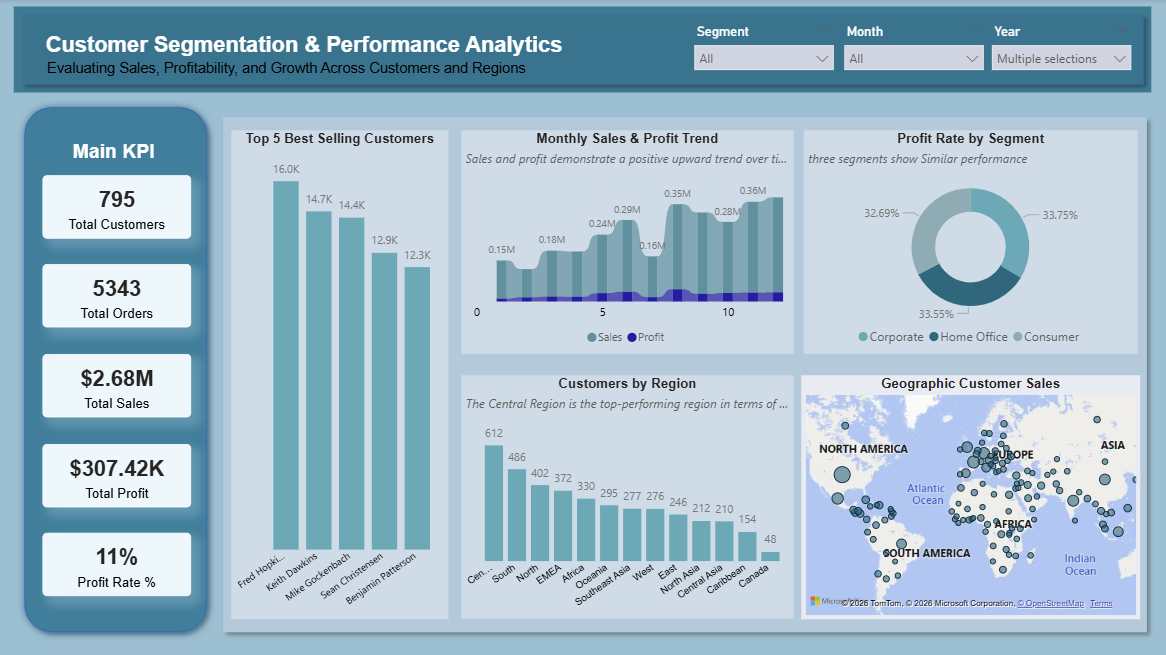
   The solution consists of interactive dashboards that analyze customer segmentation, sales and profit performance, product trends, and margin efficiency. Time-series and Year-over-Year (YoY) analysis are incorporated to track performance changes over time and identify growth patterns, margin pressure, and loss-making areas.
   This project emphasizes business storytelling, combining well-defined KPIs with clear visual design and executive-level insights. It demonstrates practical BI skills such as data modeling, DAX-based KPI development, and trend analysis, while focusing on real-world business questions like identifying high-value customers, optimizing product portfolios, and improving profitability.

  • Tools: Power BI, SQL
  • Techniques: DAX, Power Query, Data Modeling, Time-Series Analysis, Business Intelligence
  • Output: Interactive dashboards + insights


Customer Segmentation Analysis Dashboard

Campaign Performance and Customer Composition Analysis Dashboard


   This project analyzes marketing campaign performance and customer behavior for a retail food and beverage business using Power BI. The goal is to transform raw marketing and customer data into actionable insights that support data-driven marketing and business decisions. The dashboard evaluates the effectiveness of multiple marketing campaigns based on purchase volume and revenue, identifies top-performing product categories, and analyzes customer demographics and purchasing patterns. By combining campaign data with customer attributes such as age, income, education, marital status, and household composition, the project provides a comprehensive understanding of who the customers are and what drives their purchasing decisions.
   A key component of this project is the purchase driver analysis, which highlights the factors most strongly influencing campaign acceptance and sales value. The analysis reveals income as the primary driver of performance, while channel analysis confirms in-store purchases as the dominant conversion channel. The project is designed with an executive storytelling approach, featuring a structured dashboard layout, a dedicated insight explanation page, and business-focused recommendations. This ensures insights are easy to interpret for both technical and non-technical stakeholders.

  • Tools: Power BI, SQL
  • Techniques: DAX, Power Query, Data Modeling, Time-Series Analysis, Business Intelligence
  • Output: Interactive dashboards + insights


Sentiment dashboard

Sentiment-Driven Product Recommendation and Sales Insight for E-Commerce


a web-based visualization dashboard was developed and integrated as the front-end component of the project. The dashboard enables users to interactively explore sentiment analysis results, review metrics, and sales insights derived from product review data.    This project utilizes how sentiment analysis can enhance product recommendations and sales insights within e-commerce platforms. The aim of this project is to examine the application of sentiment analysis in review evaluations to make product recommendations and generate actionable insights to identify which product category has the highest performance. Sentiment analysis, machine learning, and visualization are combined to help e-commerce companies and customers make better decisions by bridging the gap between unstructured review data and actionable product suggestions.
   It applies Natural Language Processing (NLP) techniques—including text preprocessing, feature engineering, and TF-IDF vectorization —to Amazon product reviews to develop a sentiment-driven recommendation system.Supervised machine learning algorithms, including Logistic Regression, Naïve Bayes, and Support Vector Machine (SVM), are used to classify user reviews into positive, negative, or neutral sentiments. The technology provides important data, including sentiment distribution, price-performance analysis, rating trends, and review patterns across product categories on an interactive visualization dashboard, in addition to producing individualized product suggestions.
   Experimental results demonstrate that Logistic Regression achieved the best performance with an accuracy of 90.15% and an F1-score of 0.9008, outperforming Naïve Bayes (70.27%, 0.6416) and SVM (87.71%, 0.8745). These results confirm that real-time visualization and interpretable machine learning models work well together to turn user-generated content into actionable intelligence for more intelligent e-commerce tactics.

PythonMachine LearningNLPFlaskChart.jsD3.js
Healthcare ED dashboard

Medical Facilities Data Visualization Dashboard

This dashboard analyzes a dataset of medical facilities and provides insights into key performance indicators and trends.

D3.jsWebSockets


Amazon Prime Dashboard

Amazon Prime Content Trends & Profit Dynamics

Tableau dashboards uncover content performance, profitability, and subscription growth patterns.

Tableau Data Visualization