Customer & Product Performance Analytics Dashboard
Power BI|Business Intelligence|E-commerce Analytics
About This Project
This project is an end-to-end Business Intelligence solution developed using Microsoft Power BI
to analyze customer performance and product profitability using the Global Superstore dataset.
The dashboards focus on KPIs, segmentation analysis, and time-based trends to convert raw
transactional data into actionable business insights.
The objective of this analysis is to understand how different customers and regions contribute to sales, profitability, and overall business growth.
By identifying high-performing segments and trends, the business can make data-driven decisions to maximize revenue and improve customer targeting.
- Designed and developed an end-to-end Power BI dashboard solution.
- Built a data model (star schema) using transactional e-commerce data.
- Created key KPIs using DAX (Sales, Profit, Profit %, YoY Growth).
- Performed customer segmentation and product profitability analysis.
- Transformed raw data into actionable insights and business recommendations.
Business Problem
E-commerce companies often struggle to understand which customers, products, and categories truly drive revenue and profitability. Without clear visibility, it becomes difficult to optimize pricing, reduce losses, and make strategic product decisions. This project addresses that challenge by providing a data-driven view of customer segmentation, product performance, and profit trends to support better business decisions.
Tools & Skills
Dashboard Preview
Customer Segmentation & Performance
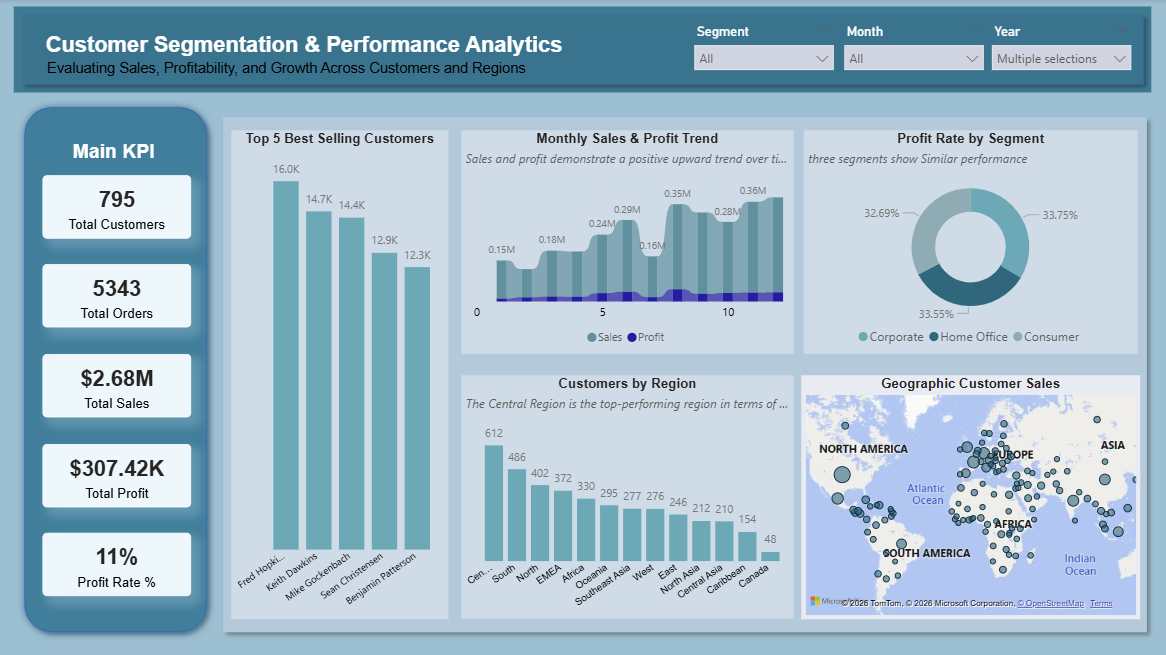
This dashboard explores customer segmentation and performance by analyzing sales, profit, customer distribution, and geographic trends. The results show that total business performance is strong, with $2.68M in sales and $307.42K in profit, but revenue is concentrated among a few top customers. Monthly trends indicate stable growth, while the Corporate segment contributes the highest share of profit. Regionally, the Central region leads in customer performance, revealing a benchmark for expansion strategies in lower-performing markets. Overall, this dashboard supports data-driven decisions in customer targeting, profitability improvement, and regional growth planning.
Product Performance, Profitability & Trends
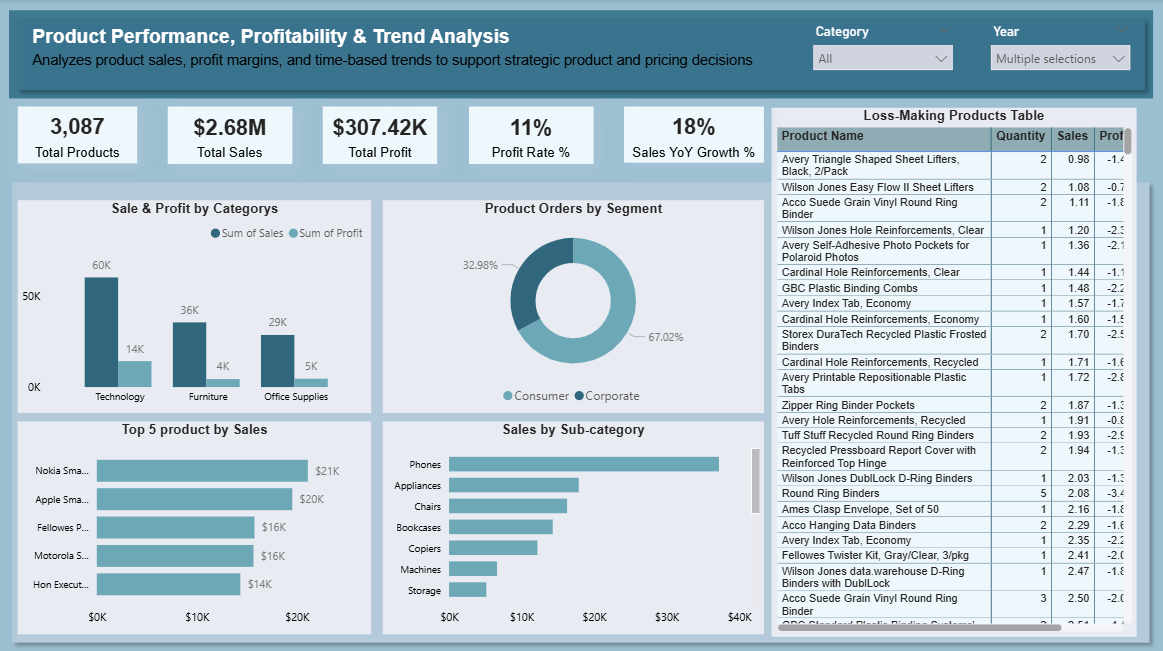
This dashboard analyzes product sales, profitability, and growth trends. It shows that Technology products lead in sales, Consumer segments drive most orders, and a small group of products contributes the highest revenue. However, several loss-making products reduce overall profitability, highlighting opportunities for pricing optimization and product portfolio improvement.
Key Insights
- The Monthly Sales & Profit Trend chart shows steady revenue growth, while slower profit growth indicates margin pressure.
- The Top Customers and Top Products charts reveal revenue concentration, where a small group drives a large portion of sales.
- The Segment Analysis chart shows Consumer customers drive volume, while Corporate segments contribute higher profitability.
- The Sales by Category chart highlights Technology as the strongest revenue driver but with relatively lower profit margins.
- The Loss-Making Products table identifies products with negative profit, indicating pricing and cost inefficiencies.
Business Impact
- Enables management to quickly identify profit drivers vs. loss areas
- Supports data-driven pricing and product strategy decisions.
- Improves visibility into customer behavior and segmentation performance.
- Helps prioritize actions that can increase profitability and reduce operational risk.
Recommendations
Focus on optimizing loss-making products identified in the loss table, scaling high-performing Technology products, and improving pricing strategies based on category-level profitability. Leveraging strong Consumer demand and promoting high-margin segments will help increase profitability and support sustainable growth